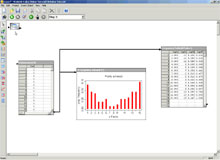
 After starting the Statistical Lab, a statistical worksheet is drawn up. With a mouse-click you can place objects such as data frames, frequency- and contingency tables and time series on this worksheet. Data can also be extracted from Microsoft Excel files or plain ASCII files using the integrated data importer. The random number generator can provide random numbers as research material.
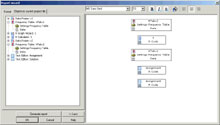
The various objects can be linked using our 'connector'. By using the connector data is transfered from one object to another for further processing. This supports a step-by-step analysis of complex procedures and even improves comprehension of complex phenomena. Thus, the students can determine the logic and an individual order of processing every assignment.
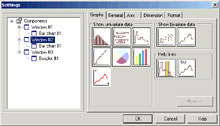
Standard graphs such as histograms, boxplots or scatterplots can easily be drawn using the 'R-Graph Wizard'. Depending on the desired complexity, individual variables can be graphed and provided with additional features such as measures of central tendency.
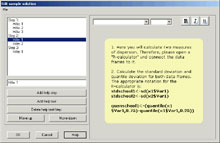
It is possible to create assignments as sample solutions. Incentives towards a solution and eventually the entire solution are provided on a step-by-step basis.
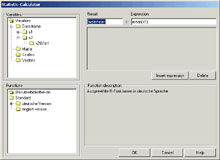
The powerful statistical programming language R is completely available inside the Statistical Lab and can be acccessed through the 'R-code Wizard'.
This interface offers experts flexible posibilities for working on statistical problems. Teachers can easily create complex simulations and interactive experimments in R, that can normally only be programmed as Java-applets.
The R-code Wizard enables beginners to write simple commands in R code without being familiar with the syntax of this language. This is very useful as introduction to R as well as an effective way of working on simple procedures.
 User libraries
Teachers can create individual scenarios and implement them in the functions of the Statitistic Lab by writing their own libraries. Thus, students can use very complex procedures without being confronted with the difficult code that is required for doing so.
Creating statistical reports is among a statistician’s most important assignments. Therefore, the Statistical Lab offers a report editor, in which all graphs, texts and objects can be implemented.
The report can be saved in *.RTF format and later be opened in MS-Word or OpenOffice-Word for further processing.
This feature especially supports the usage of the Statistical Lab as platform for taking exams.
Get to know the possibilities of the Statistical Lab:
Simulating Quincunx
(Galton Brett)
Preview
Open assignment
Manipulating data
Preview
Open assignment
The Monty Hall problem (Ziegenproblem)
Preview
Open assignment
The Statistical Lab is winner of the swiss, german, austrian Medida-Prix 2003!
Read the jury's justification here (german).